
Data Dashboard

Success-Ready Students Network (SRSN) Data Dashboard
In Kearney School District, we are committed to helping every student develop the knowledge, skills and character to succeed in high school, college and their careers.
This dashboard outlines the quantitative and qualitative indicators that inform how KSD prepares each student for success in life. This information hub was created as part of ongoing efforts in collaboration with the Success-Ready Students Network to:
- Reflect on meaningful data and performance indicators
- Create ongoing transparency with stakeholders via data dashboards
- Drive school improvement and keep students centered in our work through a continuous improvement framework

About SRSN
The SRSN supports Missouri public school stakeholders in using a competency-based mindset to personalize learning in ways that ensure every student has the knowledge, skills and dispositions they need to be high school, college, career and workplace ready.
State Report Card
Most, but not all, of the data included in the building- and district-level report cards are submitted to the Department of Elementary and Secondary Education (DESE), pursuant to Section 160.522, RSMo, by school districts at different times during the year through the Missouri Student Information System (MOSIS) and Core Data Collection System.
Key statistics about Missouri's public school districts are available online through the Missouri Department of Elementary and Secondary Education (DESE), including information required by law.
View the state’s annual report cards.
View the state's School District Report Card. From the drop-down menu, select Kearney R-1.
State Report Cards by school/building are also available here from DESE.
View a Report in Another Language
- Open the report you would like to view
- Select the three-dot menu in the upper-right corner of the report window
- Select Translate
- Choose your preferred language
Need help? Contact Kearney School District at 816-628-4116 or communications@ksdr1.net for assistance accessing or understanding a report.
Missouri Assessment Program (MAP) Results
Grade-Level Assessments (GLA)

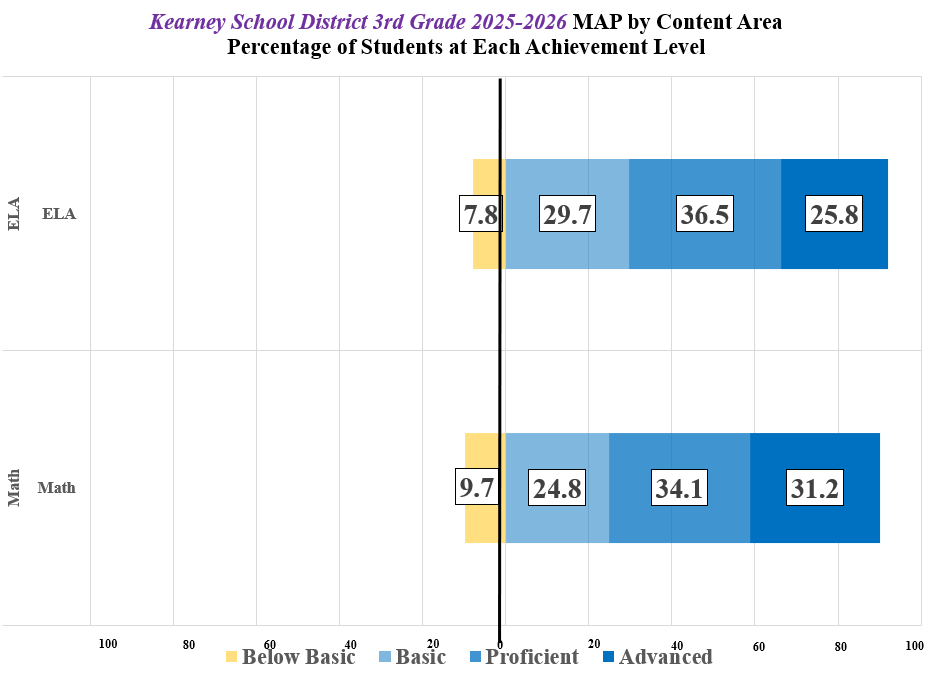
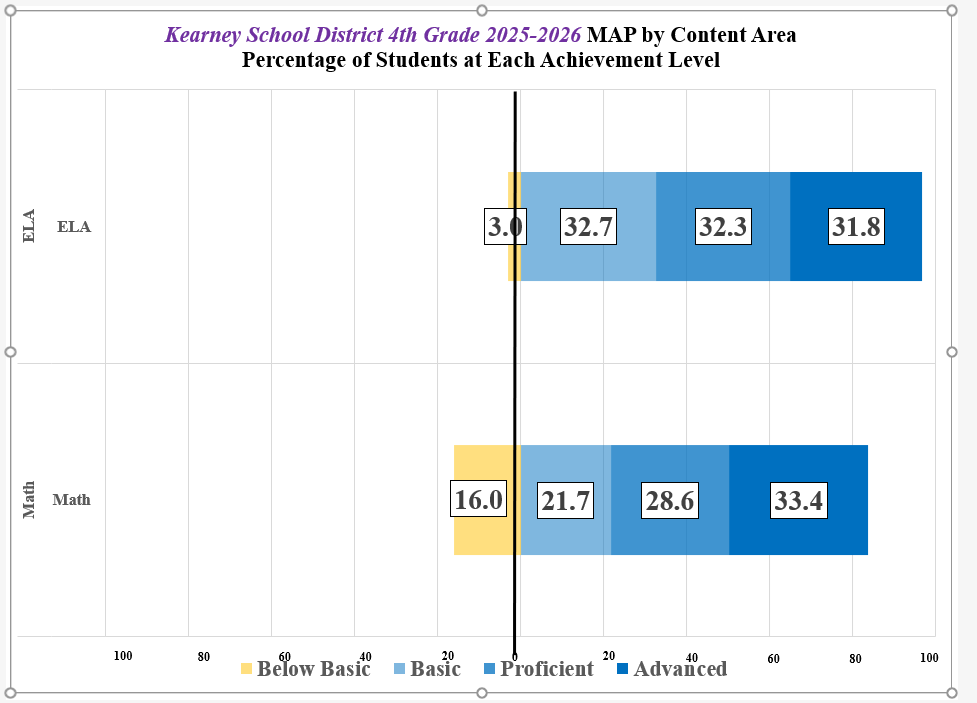
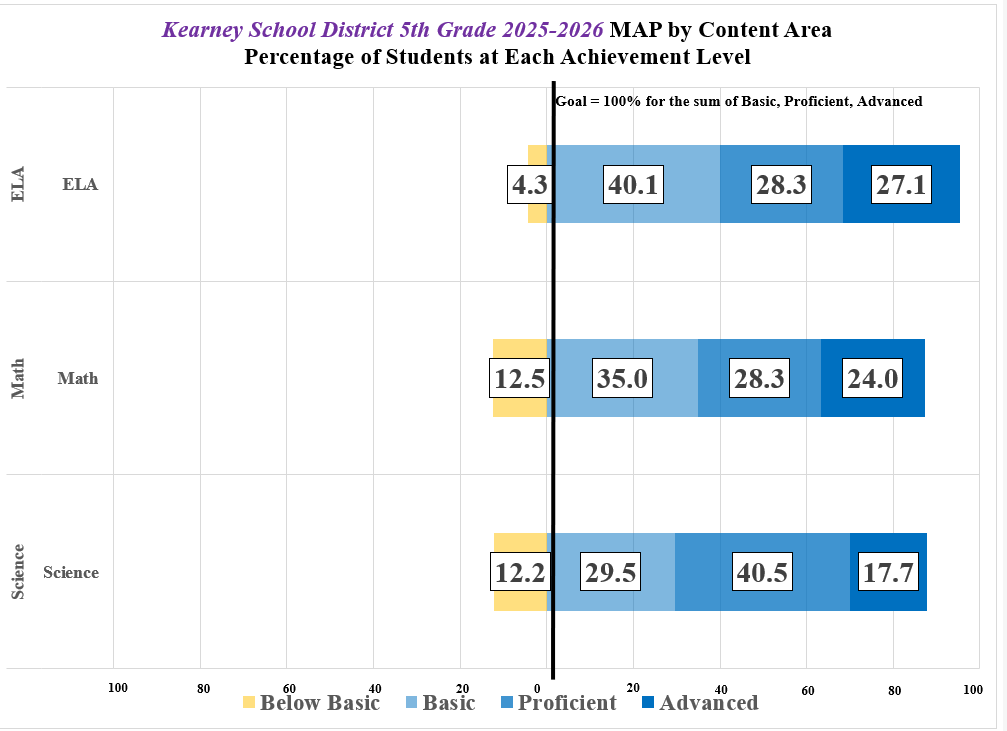
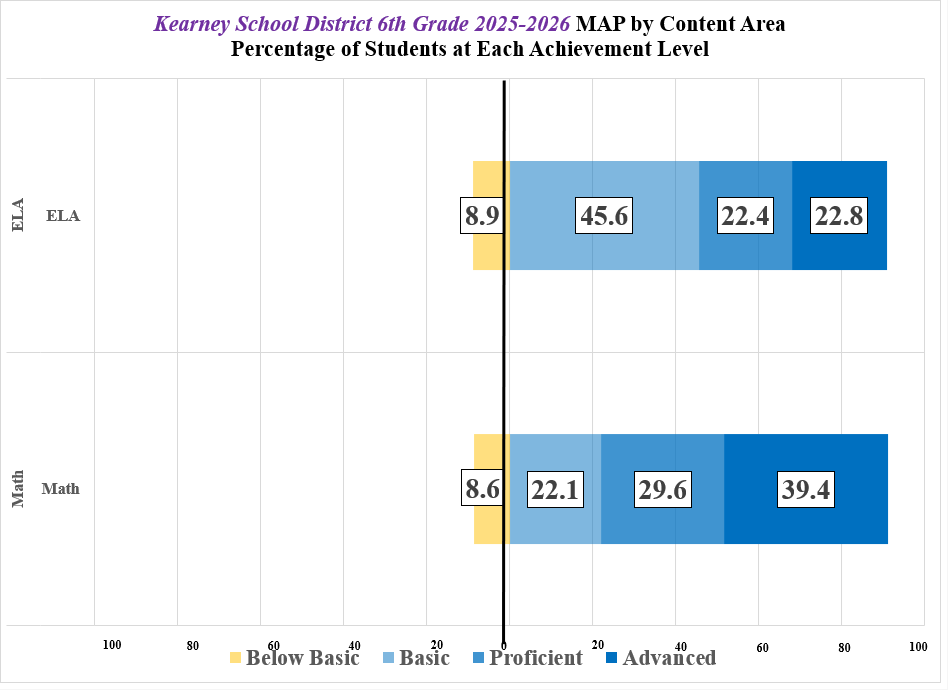
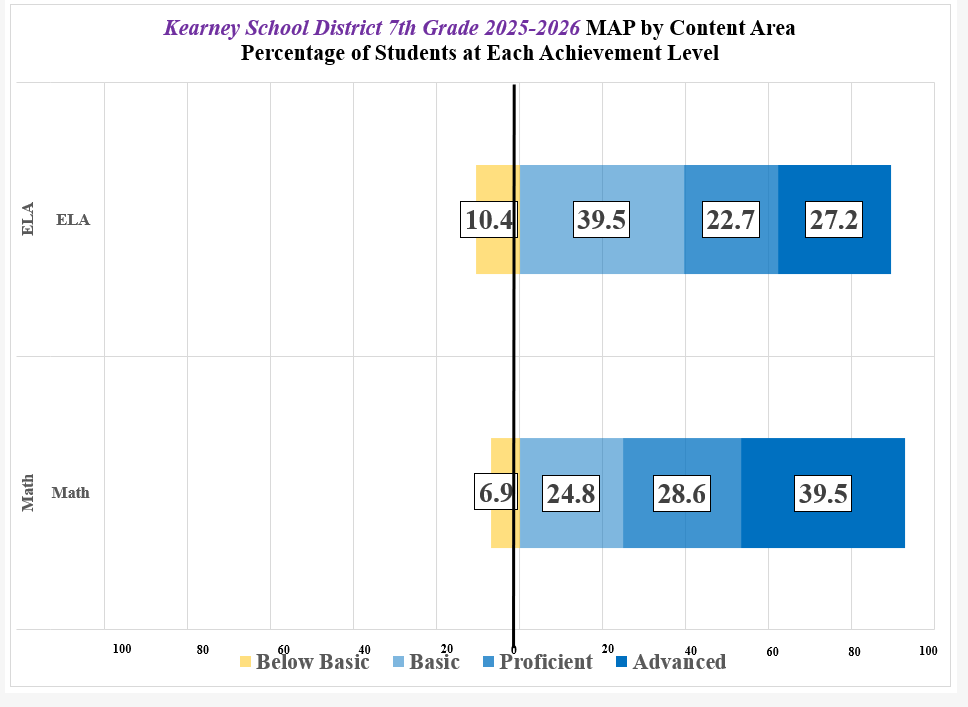
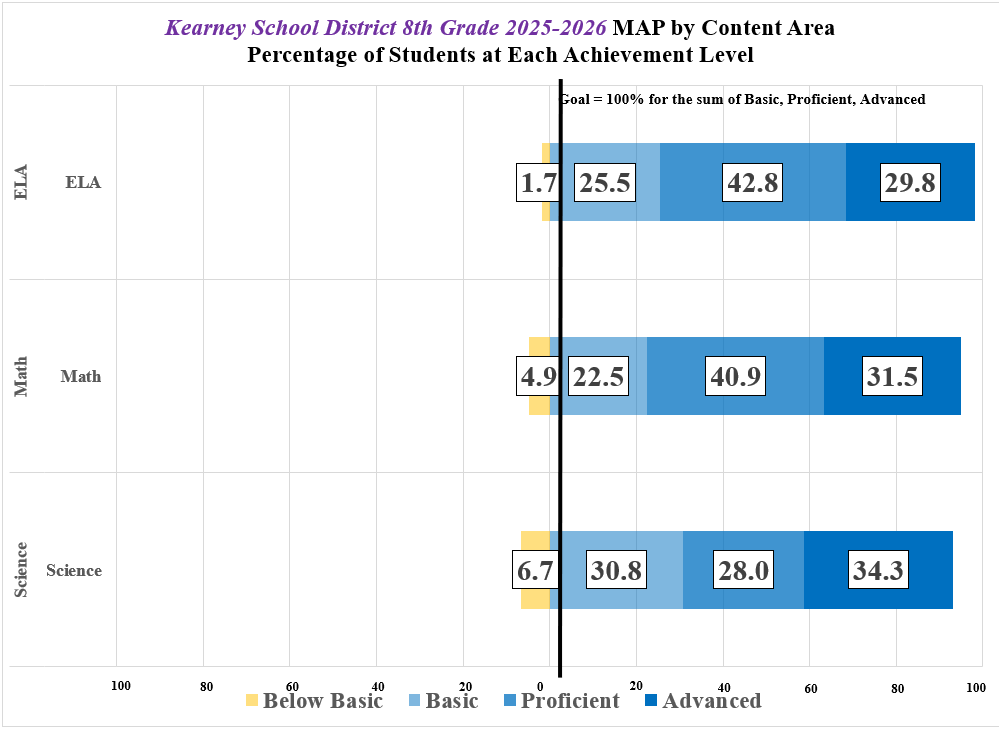
Grade-Level Assessments (GLA) measure achievement for students in English Language Arts and Math (grades 3-8) and science (grade 8). The MAP is administered annually in the spring.
2023-2024
Third Grade

Fourth Grade

Fifth Grade

Sixth Grade

Seventh Grade

Eighth Grade

2024-2025
Third Grade

Fourth Grade

Fifth Grade

Sixth Grade

Seventh Grade

Eighth Grade

2025-2026
Third Grade
Fourth Grade
Fifth Grade
Sixth Grade
Seventh Grade
Eighth Grade
End of Course (EOC) Exams
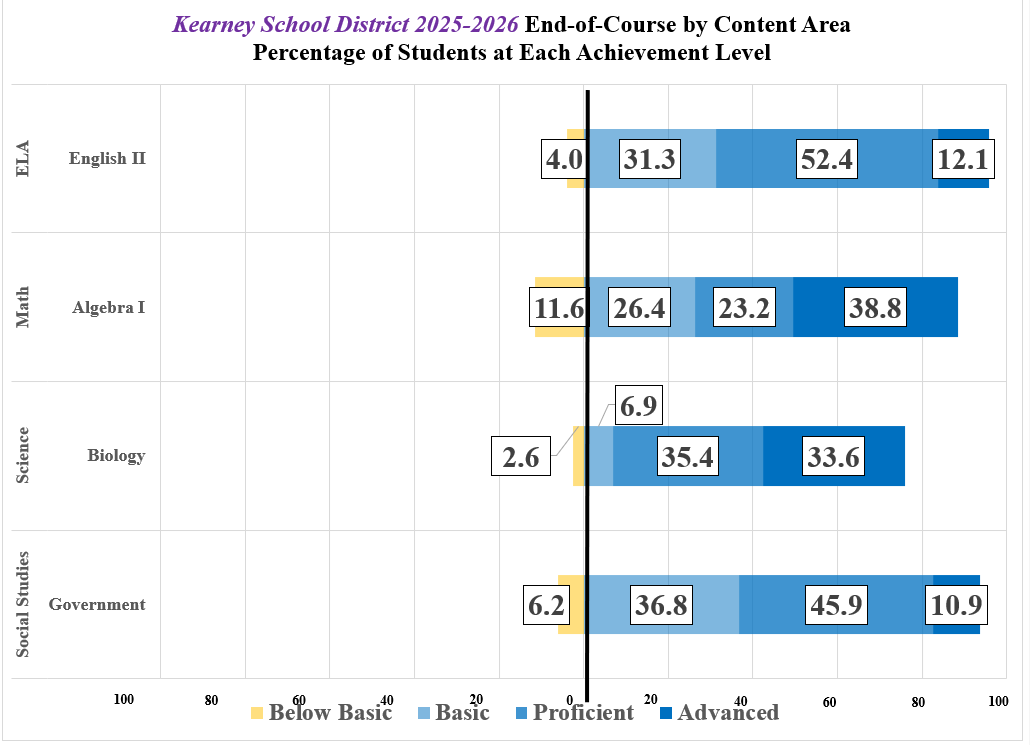
Students in Missouri have four End-of-Course assessments that are required prior to high school graduation: Algebra I, Biology, English II and Government. Optional assessments are available for local accountability in Algebra II, American History, English I, Geometry, Personal Finance and Physical Science. For students who complete the Algebra I EOC assessment prior to high school, Algebra II is the required high school mathematics assessment for accountability purposes.
2023-2024

2024-2025

2025-2026
Interim Assessment Data
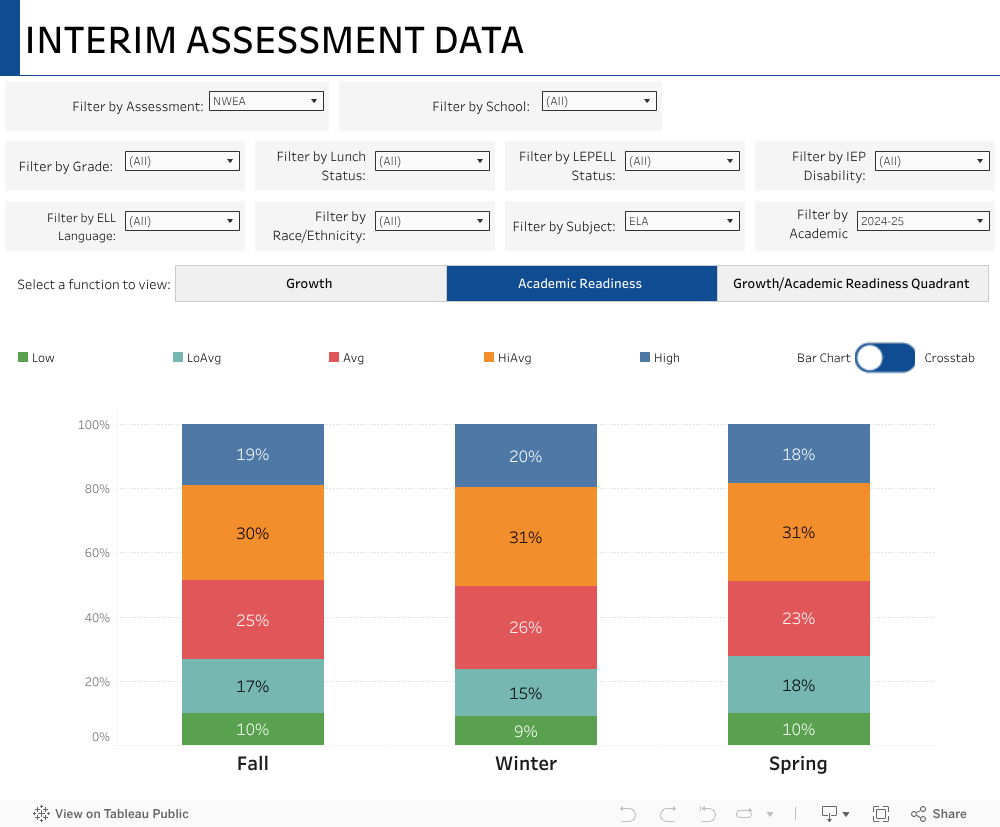
Our NWEA assessment data tracks student growth and achievement at various points throughout the year by utilizing interim benchmark data instead of a single summative MAP test each spring. Required MAP testing is held at the end of the year. Final NWEA assessments for KSD grades 3-8 are administered at the end of the third quarter. This means that student results will only reflect three out of four quarters of instruction, which will reveal opportunities for growth and ways to increase student achievement.
This data guides teachers as they identify ways to help students grow academically. Interim benchmark assessments support educators in ways that lagging indicators, such as a MAP test score, can't. These benchmarks inform teachers about student growth and achievement in real-time, allowing educators to modify instruction for students immediately.
Our database includes metrics for academic readiness and growth for grades 3-8 in English Language Arts and Mathematics. Watch the video below for more information about navigating the data dashboard.
Student growth
This measures the extent to which a student is “on track” to demonstrate a foundational understanding of grade-level standards by the end of the school year.
Academic Readiness
This reflects a student’s level of academic content knowledge at a point in time.
Academic Readiness with Growth Quadrant
This data combines the academic readiness and growth measures to describe the extent to which students are growing as expected in demonstrating grade-level standards.
College, Career & Workplace Readiness
Our data dashboard includes College, Career and Workplace Readiness because we want families to know how we’re helping students gain the skills and experiences they need to succeed in whatever path they choose after high school. Click on each icon below to view our results!


